Technical analysis is one of the most important pieces of knowledge to have when investing in traditional or digital assets. Using charts and various technical indicators can help you make the right moves in entering or exiting a market. That’s why we’ve assembled this list of the best crypto charts that you can start using today. These are the best crypto tools you can use for cryptocurrency graph analysis and give you the best crypto indicators. Let’s jump in.

TradingView
TradingView is not only one of the best crypto live charts on the market, it’s just one of the best charting platforms in general. There is a mobile app available for Android and iOS devices allowing you to look at and work with one of the best crypto charts on the go. They also offer a desktop app.
TradingView has a free plan that only lets you look at one chart at a time, but it gives you access to over 400 technical indicators for free and allows you to draw as well. TradingView has charts for essentially any asset that is on major cryptocurrency exchanges like Binance and Coinbase, for spot, futures, and derivative markets. You can try their premium plan for 30 days before deciding if you want to pay for it long-term.
GlassNode
GlassNode is one of the best crypto charts bar none, as it is one of the only crypto charting platforms that also has on-chain analysis information for a variety of blockchains. This includes information such as levels of Bitcoin on exchanges, how long wallets have been holding BTC, and much much more.
GlassNode has a free plan that gives you access to some of the basic data, but its premium plans are where you can really find the best data. Rather than basic trading charts like you find on the other platforms on this list, GlassNode has much more specific data such as Short-Term Holder Profit/Loss and Addresses with a Balance over 0.1 BTC.
Coinigy
Coinigy is the most crypto-focused charting platform on this list as they don’t offer any non-crypto market charts. They offer charts for over 5,000 crypto assets across 46 cryptocurrency exchanges. It also allows you to connect your exchange accounts and crypto wallets to the platform through APIs and execute trades through Coinigy.
Coinigy has a 7-day free trial but the service costs $18.66 a month minimum after that. The plan is likely worthwhile if you’re going to use the platform to execute trades, but otherwise you may be better off just using TradingView’s free plan.
GoCharting
GoCharting isn’t as powerful as the previous charting platforms on this list, but it has good crypto charting with a lot of indicators and tools that you can use in their free plan. Much like TradingView, GoCharting offers free users a lot of features with additional features in their premium plan. However, the free plan is likely enough for all but the most experienced traders, who would likely be using TradingView in that case.
GoCharting allows you to track over 100 crypto assets in addition to traditional markets, with access to Indian and European market charts available. They offer all the basic technical indicators you would need to chart the asset of your choice.
CryptoView
CryptoView is a bit different from the other charting tools on the list because it uses TradingView for its charts. CryptoView is more of a portfolio management service than it is a charting platform. Yes, you can use it for charting, but if you’re only going to use it for that then you might as well use TradingView.
CryptoView allows you to trade on multiple exchanges from a single location, for a subscription fee that starts at about $20 a month. There are no additional trading fees for using the service to trade on any of the supported exchanges. CryptoView is best suited for day traders or those with multiple exchange accounts that they use frequently.
How to Read Crypto Candlestick Charts
Crypto charts have red and green candlesticks that are related to a period of time such as a day, an hour, a minute, or a month. You can adjust charts to the time frame you want to see. The chart below is Bitcoin’s on a minute-to-minute time frame.

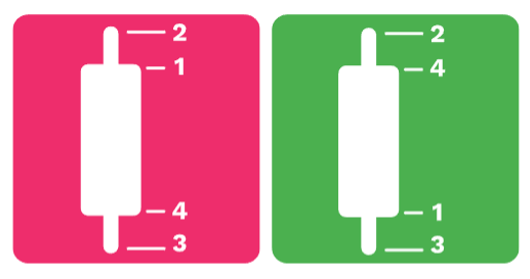
Generally speaking, a red candle means the asset finished that time frame at a loss from where it started, while a green candle means the asset finished at a gain from where it started.
A candlestick will also have a thin wick to the top and bottom. These wicks indicate the high (top wick), or low (bottom wick) for the given time frame. For example when looking at the image below, for the red candle, 1 indicates the opening price, 2 is the high, 3 is the low, and 4 is the close. The same labels can be applied to the green candle’s numbers.
Bullish vs Bearish Chart Patterns
There are a variety of chart patterns that emerge in markets, some are bullish, some are bearish, and some are both. Let’s quickly look at examples of each.
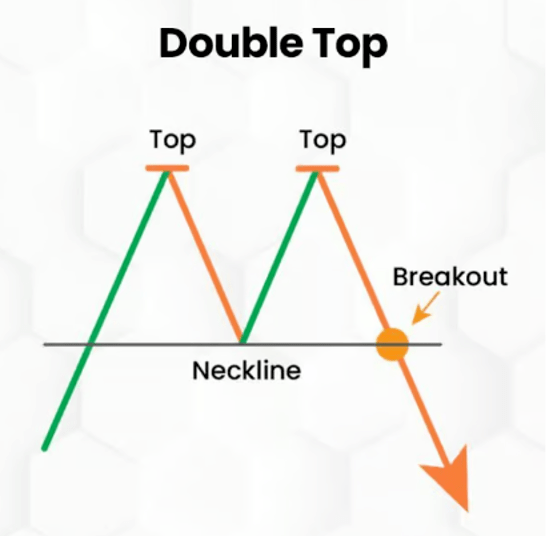
Double Top (Bearish)
A double top indicates weakening buying pressure after a top, downtrend, then another failed attempt to break through the previous top.

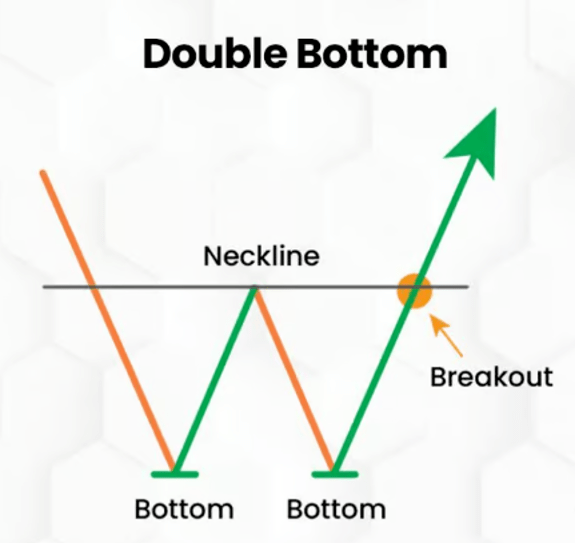
Double Bottom (Bullish)
A double bottom is the opposite of a double top, where the asset has failed to drop below levels a couple times before breaking through previous resistance.

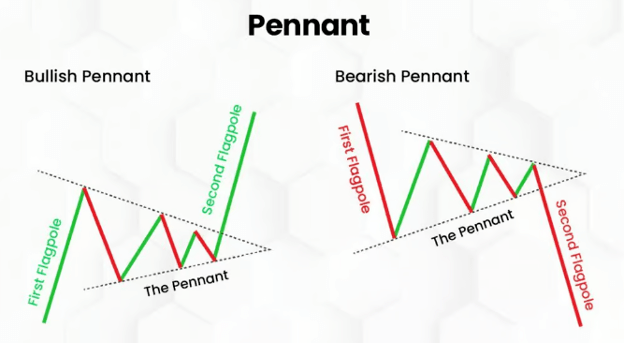
Pennant (Both)
A pennant chart pattern can indicate bullish or bearish movement depending on how it forms, with the potential for false and failed breakouts or downtrends affecting trading decisions.

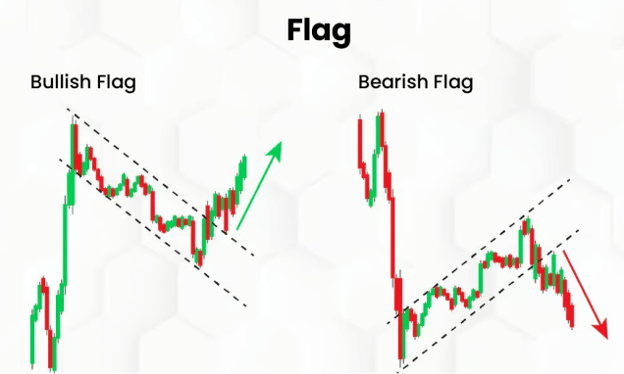
Flag (Both)
A flag is like a pennant, and it is used to help determine market entry and exit timing. Much like pennant’s, determining whether a flag is bullish or bearish can be tricky.

Wedges (Both)
Wedges can be bullish or bearish depending on the direction they’re heading. Unlike pennants and flags it’s a little clearer which way the trend is going with wedges.

Frequently Asked Questions
The two best sites for analyzing crypto are TradingView and GlassNode. They provide different information meaning that they can be combined to have the best overall picture of the crypto market.
The best RSI setting for crypto is likely on the lower end as the markets are much more volatile than traditional ones. This means that overbought and oversold indicators can happen much more quickly for crypto than for traditional markets, making lower periods of time more advantageous.

Latest News