- >News
- >How Do You Call the Bottom of a Crypto Bear Market?
How Do You Call the Bottom of a Crypto Bear Market?
Bulls may have been busy predicting record highs for bitcoin this December, but the cryptocurrency market remains in a funk. Its total cap now stands at around $2.59 trillion, representing a 13.6% comedown since it recorded a record high of $3 trillion on November 10.
The current downturn began after bitcoin reached an all-time high of $69,044, a figure which has since declined by nearly 17%. Clearly much of the market suspected that a fresh ATH would result in traders taking profits, and this is pretty much what happened, with almost all major coins (minus a few exceptions) falling by similar percentages since November 10.
The question is: when is the current period of bearishness and uncertainty likely to end? More importantly, how can investors and traders predict the end of a crypto bear market? Well, by using several technical indicators at the same time, you can at the very least gain a sense of when the market is ripe for a rebound. Not that the past is any guarantee of the future.


Relative Strength Index and Moving Averages
Let’s take a look at bitcoin, which is indisputably the bellwether of the wider cryptocurrency market, since it tends to lead rallies and downturns.
One of the most popular technical indicators you can use to gauge the state of the bitcoin market is the relative strength index. This is a momentum indicator that quantifies the strength of recent price changes in relation to previous levels. It provides a ‘score’ from 0 to 100, with anything above 70 (and particularly 80) suggesting that something is overbought. Conversely, anything below 30 indicates that a cryptocurrency or assets is oversold.
Explaining just how the RSI is calculated is beyond the scope of this article (and not necessary), but needless to say, anything that is ‘overbought’ could potentially experience a fall anytime soon, while anything that’s ‘oversold’ could see a rebound.
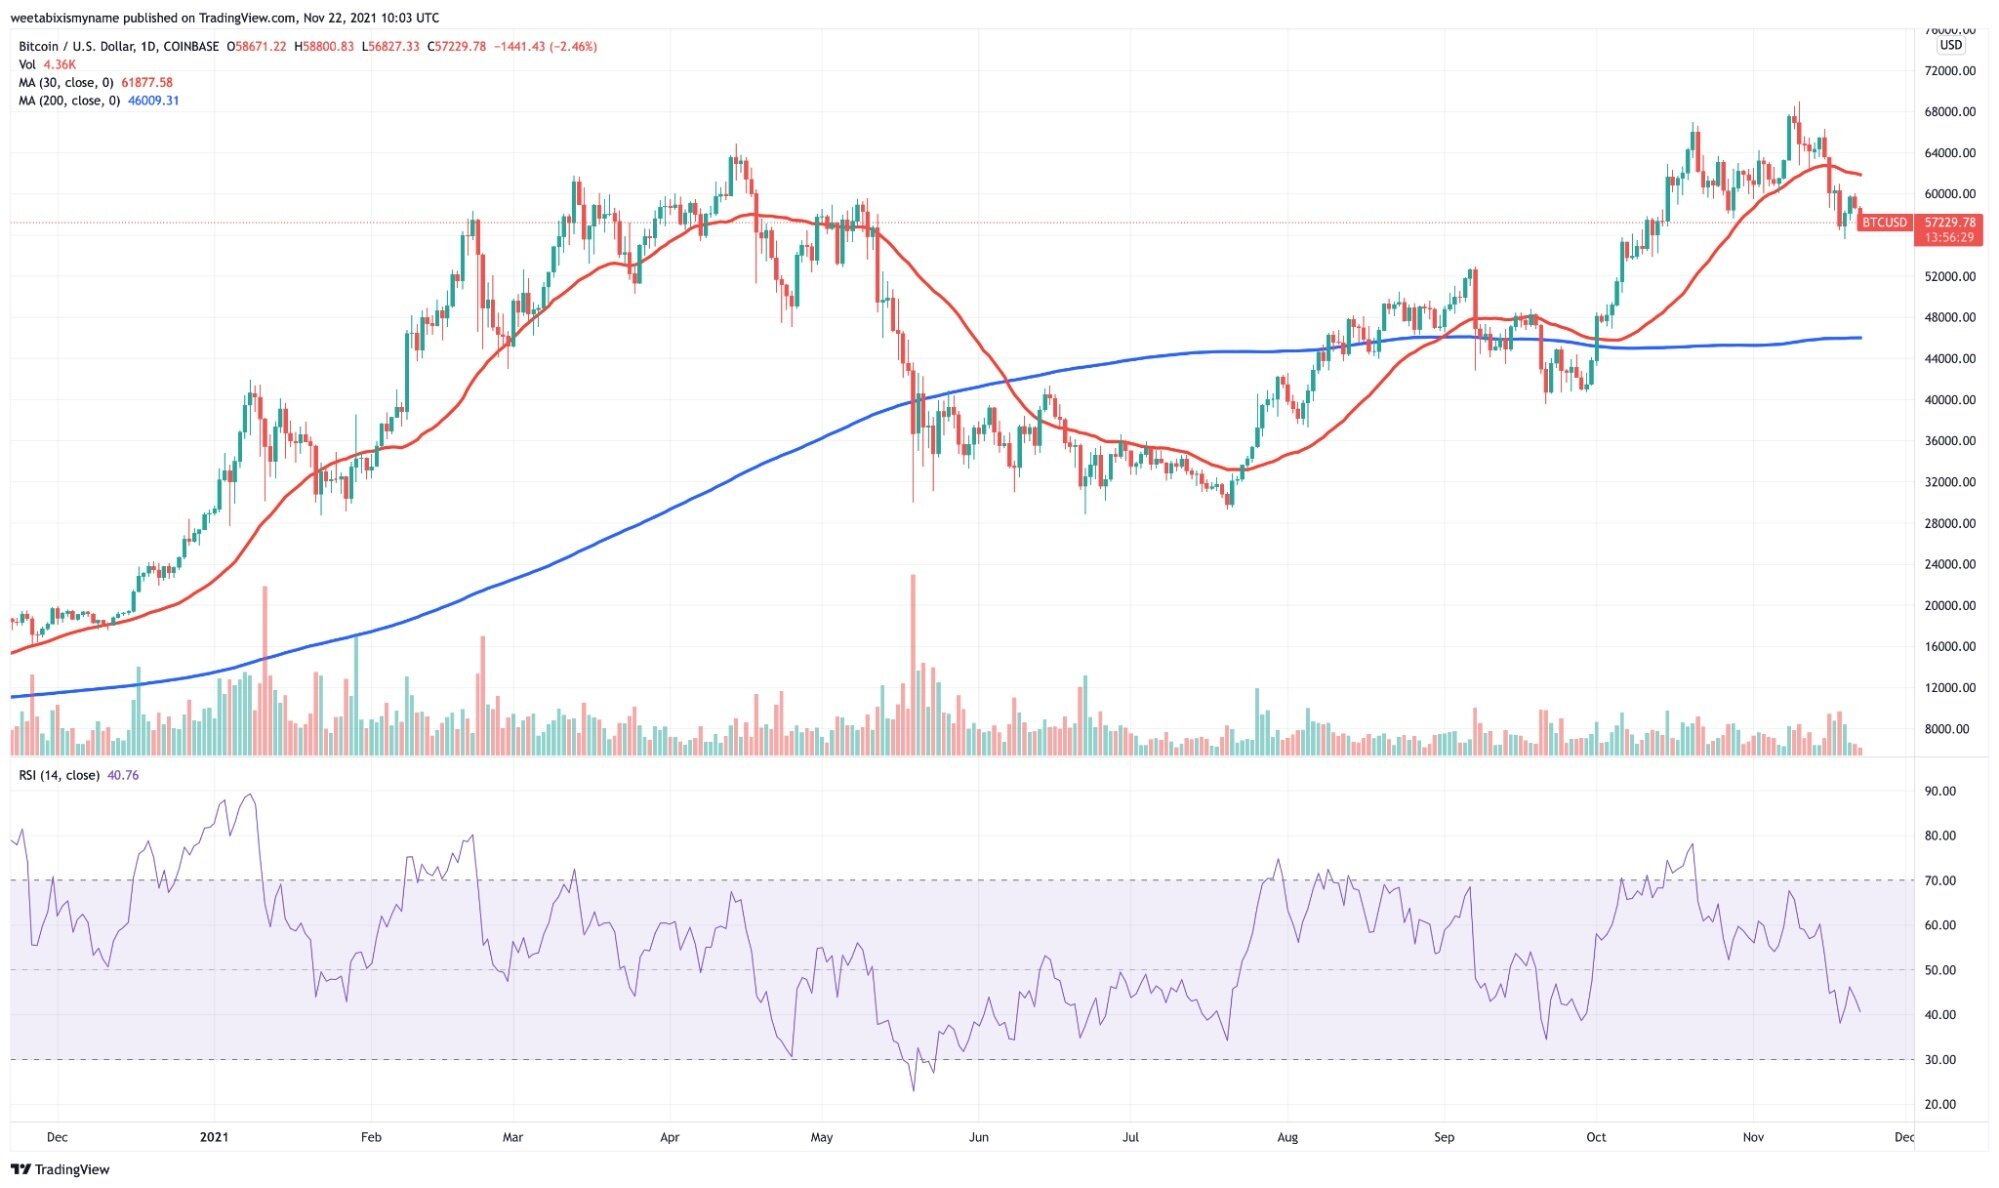
Source: TradingView
In the case of bitcoin, its RSI (in purple above) now registers 40. This has sunk from around 70 in the first half of November, when it hit its current RSI. However, it could sink lower, since 40 is not ‘official’ oversold territory.
Also, look at the period between mid-May and the beginning of August. It remained subdued for several months before it really fought back, with 25 being the absolute bottom in mid-May, but with the metric oscillating between 30 and 50 for some time before shooting upwards.
A similar story applies to its moving averages. When looking at these, it’s always a good idea to compare a short-term average — such as the 30-day (in red above) — with a longer term average — such as the 200-day (in blue). A 30-day average sinking below a 200-day average is what’s known as a ‘death cross,’ and when it happens it may indicate that an asset is beginning a slump. This is indeed what happened to BTC in June, after the cryptocurrency market declined in the wake of Tesla announcing that it will no longer accept bitcoin payments for its cars.
What’s interesting to note now is that bitcoin’s 30- and 200-day averages haven’t yet formed a death cross, although the 30-day is certainly beginning to sink. However, given that it still has some way to go before it crosses below the 200-day, we may not be seeing the bottom of this mini-slump right now.
Bollinger Bands and Wavetrends
A couple of similar metrics are Bollinger Bands and the (LazyBear) WaveTrend Oscillator. These both provide an indication of the tops and bottoms of markets, insofar as they calculate changes in price averages over time. With Bollinger Bands, you see (positive and negative) standard deviations away from a moving price average. And with the WaveTrend Oscillators, differences between various moving averages are plotted on a chart as trend lines.
In a nutshell, both of these indicators provide another window into whether something is overbought or oversold. Again, if something is ‘oversold’, we’ve most likely hit a bottom, unless the asset in question is dying (which is unlikely for bitcoin).
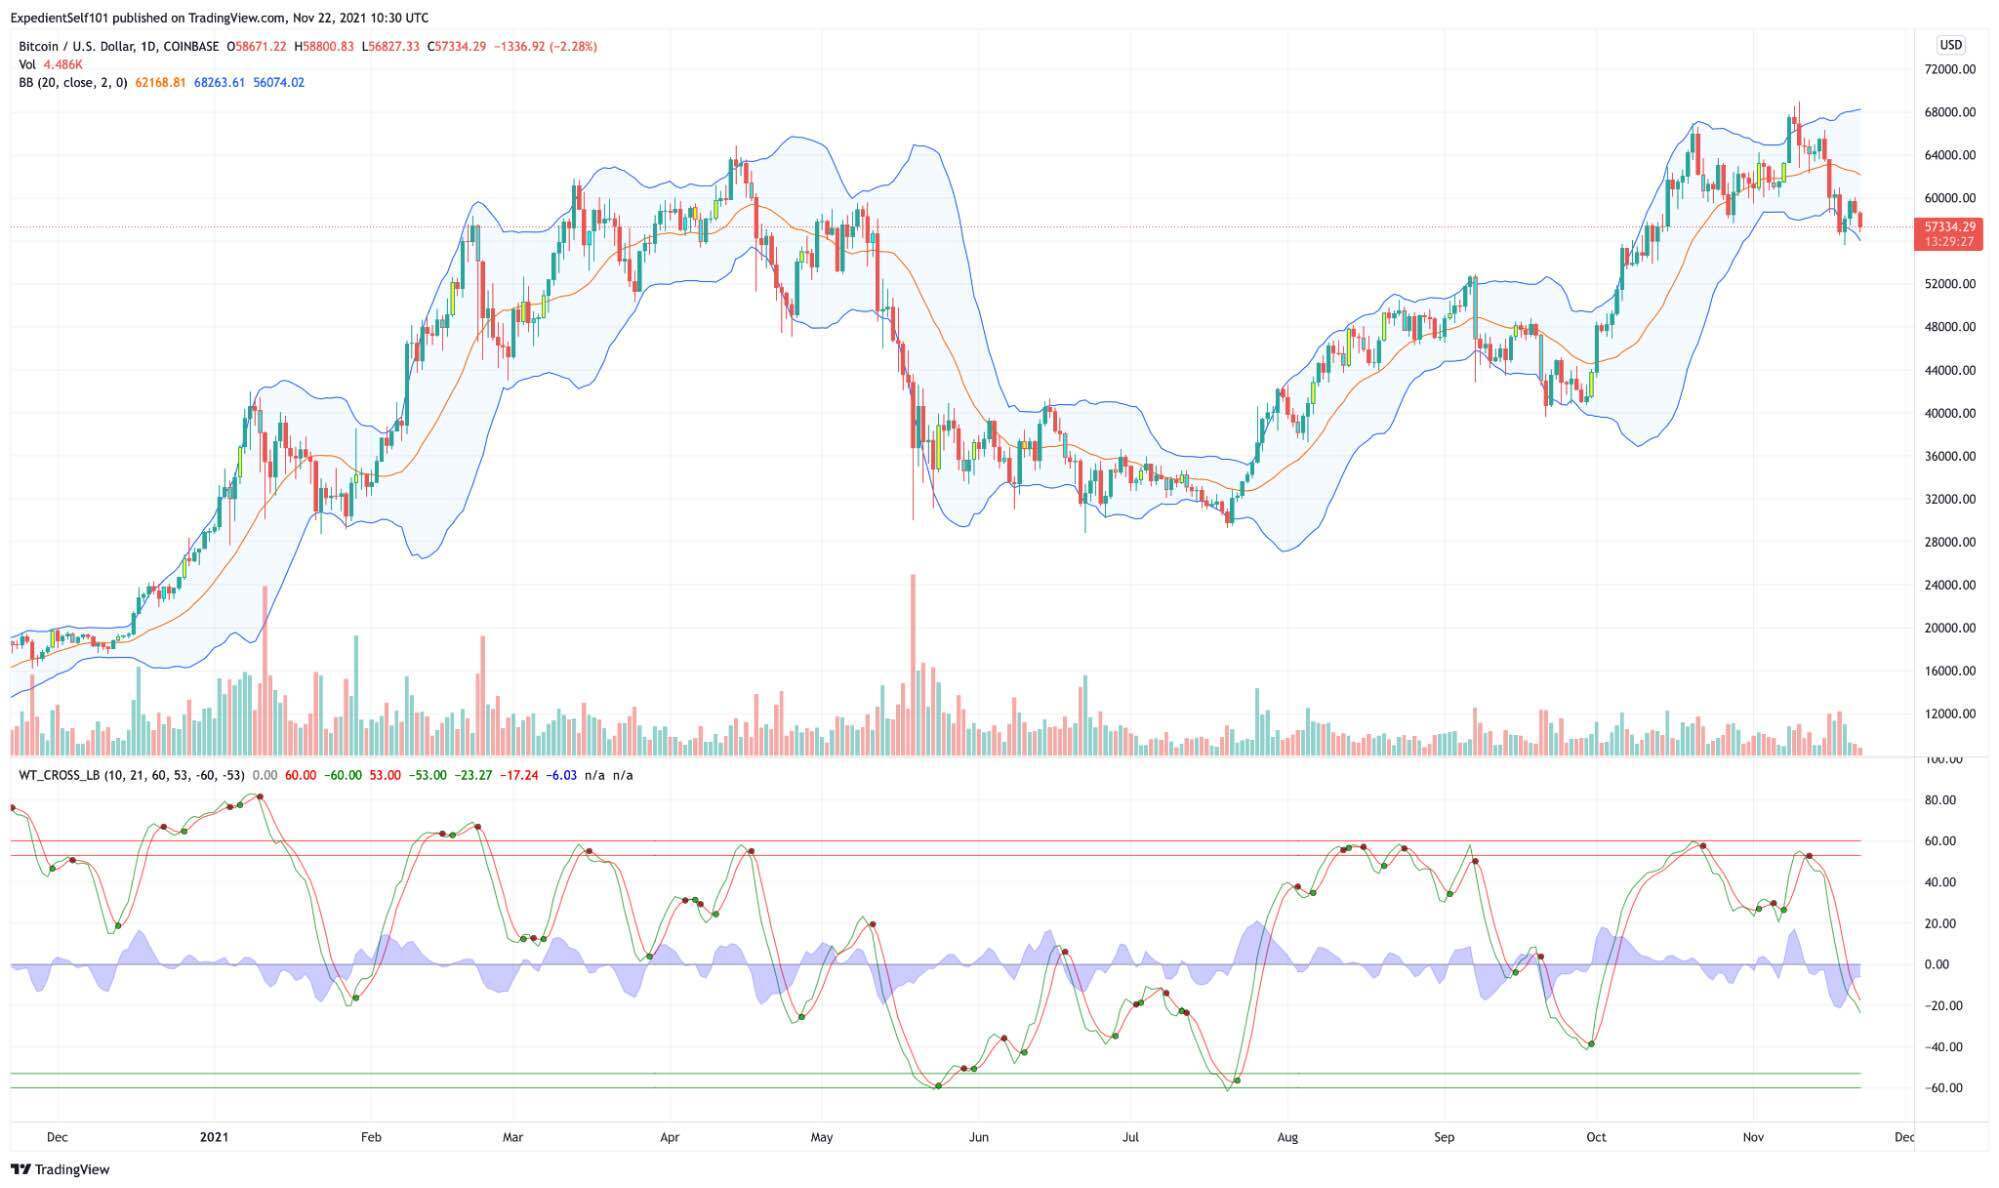
Source: TradingView
What should be noticed is that, with the Bollinger Bands (at the top in blue), bitcoin’s current price (illustrated via green and red candles) has actually fallen to the bottom of the lower band. This means its drop has taken it as low as its Bollinger Band says it should be falling.
However, with the WaveTrend Oscillator (the metric at the bottom of the chart), BTC hasn’t yet reached a bottom. If it touches the green line(s), then it’s oversold according to the metric, and can be bought with some confidence that it’s likely to jump up. This is what we saw just before the beginning of August: bitcoin’s WaveTrend oscillator reached minus 60, entering the green lines and presaging a big rebound (which did indeed happen).
Volatility and Volume
Another interesting metric is volatility. Normally, traders want high volatility, since it implies the potential for big gains. However, during a bear(ish) market, a sustained period of lower-than-average volatility (for a particular asset) may suggest that a rally is impending.
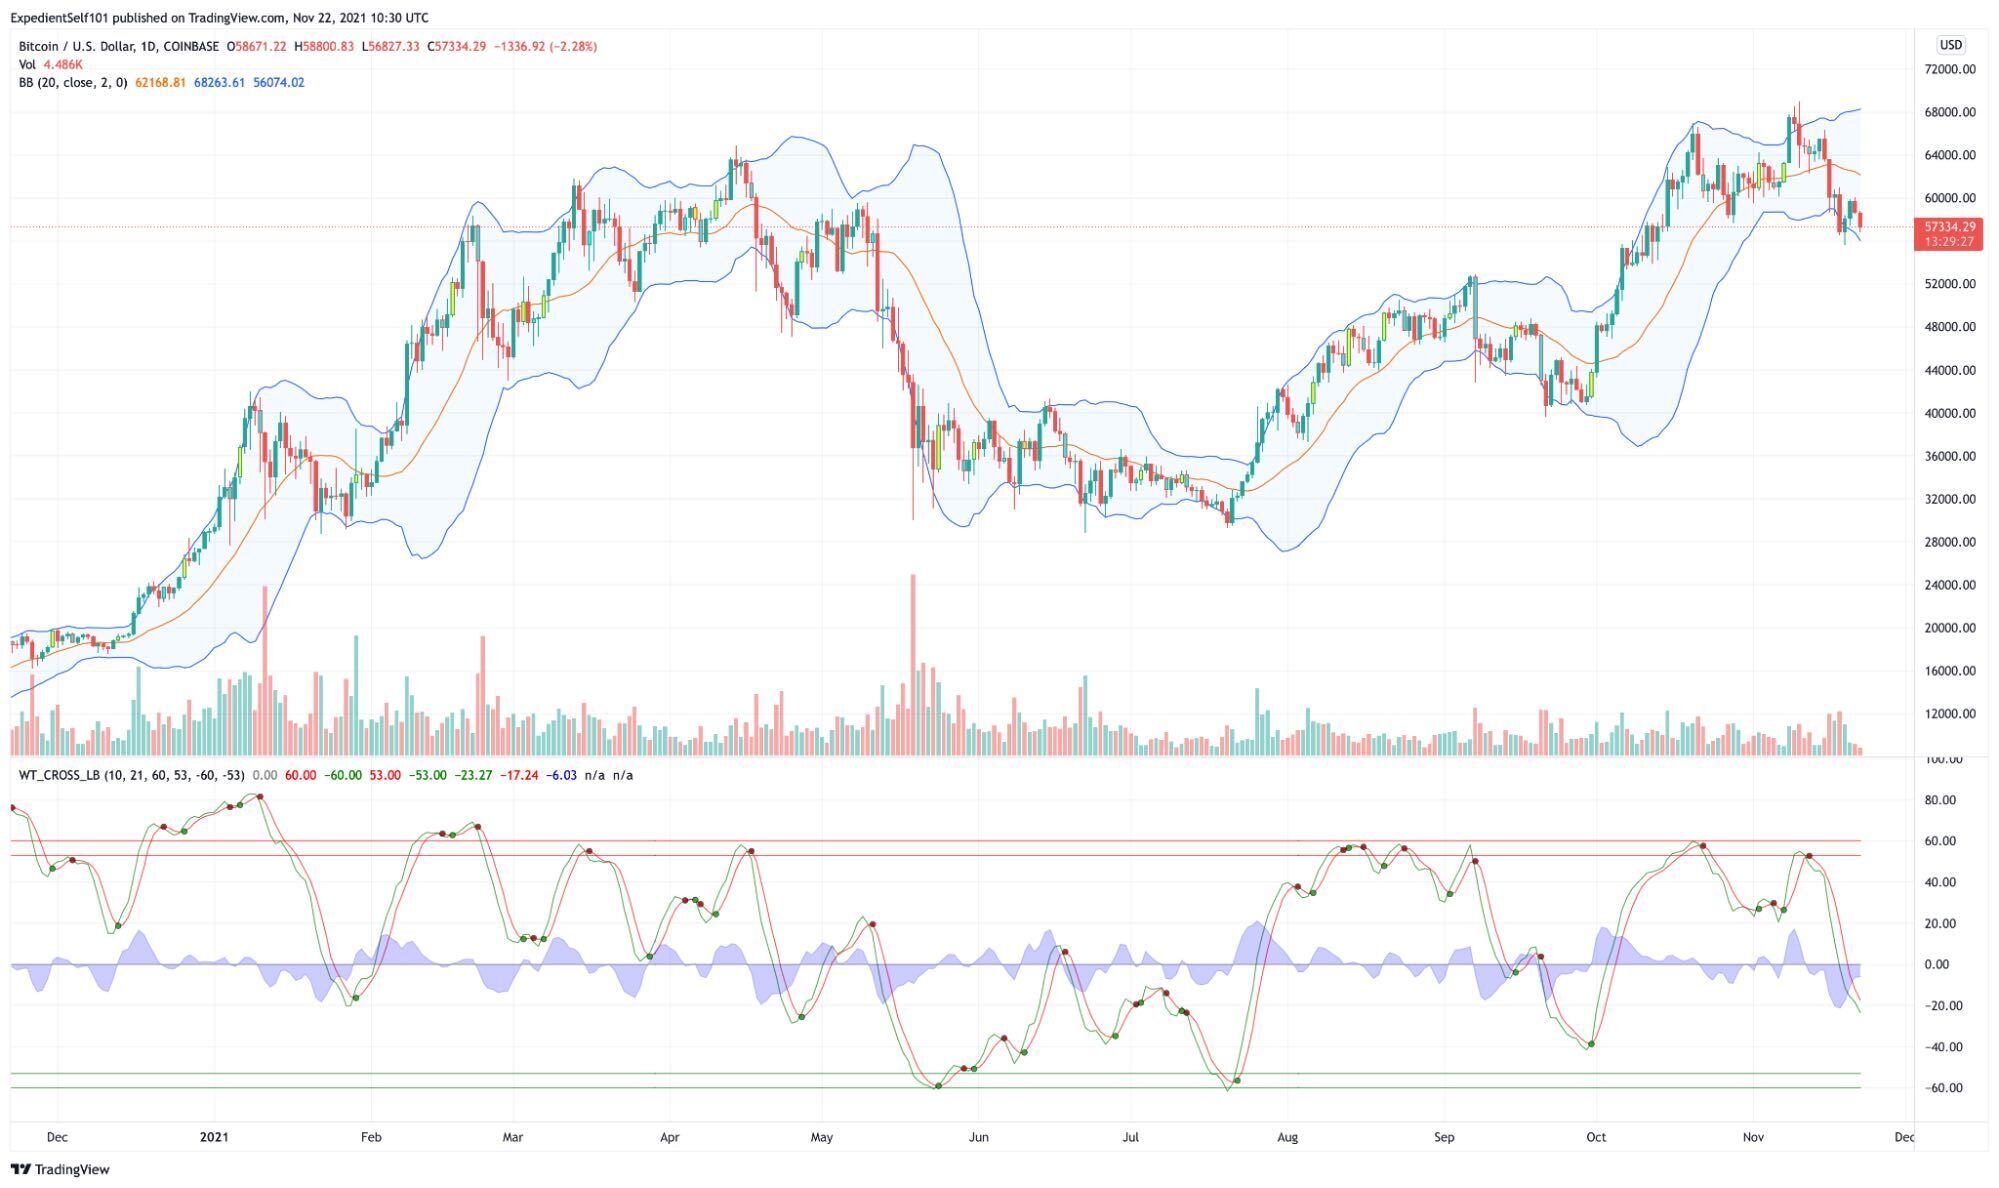
Source: TradingView
Again, its instructive to look at the period between May and early August. It shows a fall in volatility (in blue above) that, having reached a bottom, predicts a new BTC rally (which began from August onwards).
What’s curious about bitcoin’s current historical volatility, however, is that it remains quite low. What could happen therefore is that bitcoin could fall further, causing its historical volatility to increase. At which point, it would start to decline again, indicating the approach of a rebound.
It’s also interesting that bitcoin’s current volume (in the small green and red vertical bars below its price) is also relatively low in comparison to earlier in the year.
This may be a bullish signal, in the sense that bitcoin has yet to benefit from record-high volumes, something which could one day send its price to even higher records. At the same time, it may also suggest that a lot of bitcoin is actually being held for the long-term, creating the kind of supply squeeze that could cause the cryptocurrency’s price to skyrocket in the event of a fresh influx of institutions and retail investors. On the other hand, an arch pessimist may take it as a sign that we haven’t witnessed a real selloff yet.
On the Cusp of a Rebound?
By taking all of these indicators in combination, any trader can gain a sense of when bitcoin or any other asset has hit a market bottom.
If its averages, RSI, Bollinger Bands and WaveTrend Oscillators all suggest that it’s oversold, then it is likely on the cusp of beginning a rebound. Likewise, low volatility (and low volume) supports this view, pointing towards a lull in the market that could pick up once new liquidity enters.
That said, bitcoin — and the rest of the cryptocurrency market — isn’t quite in this ‘oversold’ territory right now. While it is certainly experiencing a downtrend in numerous respects, such a trend clearly has some time left to run. So this author, being something of a party pooper, might suggest that we won’t see a bottom for another few weeks yet.

Latest News