- >News
- >Report: Bitcoin Trading Volume Still Down Compared, Despite Bull Market
Report: Bitcoin Trading Volume Still Down Compared, Despite Bull Market
Bitcoin trading volume in the United States was down in early 2021 compared to a peak in June 2020, according to data compiled by Statista. Sourced from Coin Dance and taken from LocalBitcoins and other peer-to-peer exchanges, the figures show a weekly volume of $25 million for the week ending February 13, compared to $43.3 million in the week ending June 20, 2020.
This gradual decline in trading volume from June 2020 to February 2021 is curious, given the fact that the bitcoin price skyrocketed during this period, from about $9,500 in mid-June to $47,400 on February 13 (when Statista’s data ends). The fall in volume in the United States also comes amid a similar fall globally, according to additional Coin Dance data from LocalBitcoins and Paxful.
This apparent contradiction raises some uncomfortable questions about the true nature of the current bull market, arguably supporting those skeptics who continue to imply that much of the market is inflated or manipulated. However, it needs to be stressed that the Coin Dance data comes from only three (peer-to-peer) exchanges, ignoring the trading volumes of the biggest exchanges in the world, which experienced most of the growth during the bull market.


Bitcoin Trading Volume Declines in the United States and Globally
Sourced by Coin Dance, Statista’s data comes from at least three P2P exchanges: LocalBitcoins, Paxful and Bisq. Together, these three platforms actually witnessed a decline in bitcoin trading volumes in the United States between June 2020 and the beginning of this year.
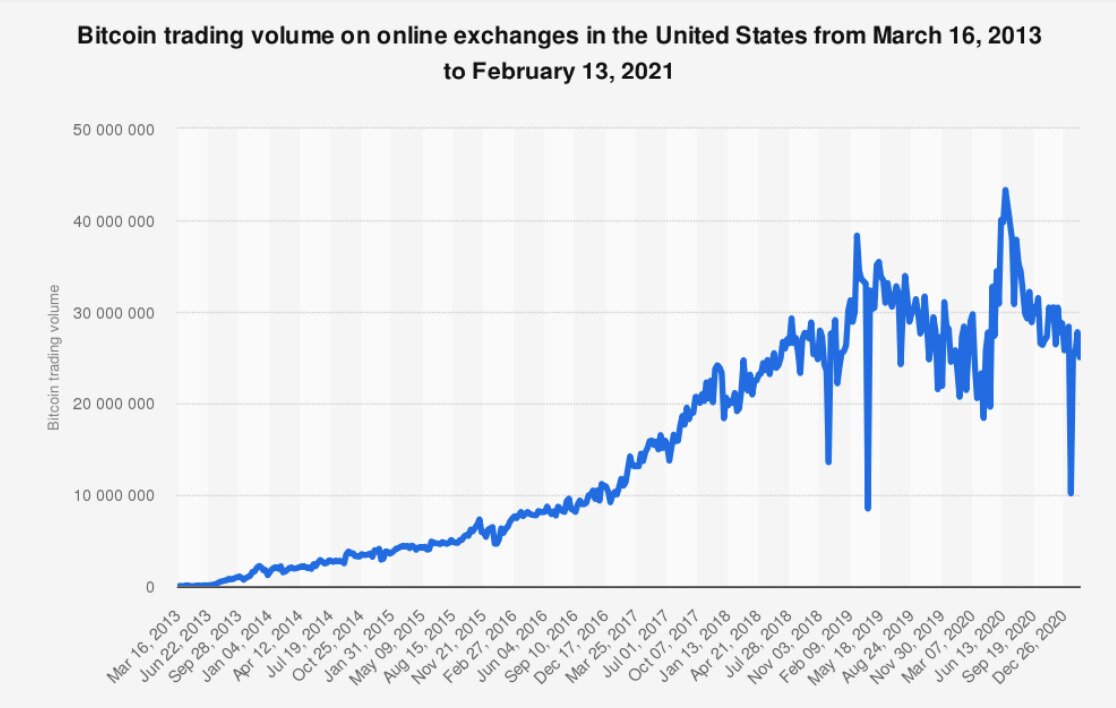
Source: Statista
As the chart above illustrates, there was a steady decline in volumes from the peak witnessed in June 2020. As Statista writes in its accompanying notes, this is strange, since it contradicts the idea that the bitcoin market entered a bull phase during this same period:
“Despite a growing Bitcoin price and increasing global interest in cryptocurrencies, U.S. Bitcoin trading in early 2021 was lower than it was during June 2020 […] In the first weeks of January 2021, less U.S. dollars were spent on buying Bitcoin than in several weeks in 2020.”
Heading over to the Coin Dance website itself and checking global bitcoin trading volumes, this picture of declining trade is actually supported.
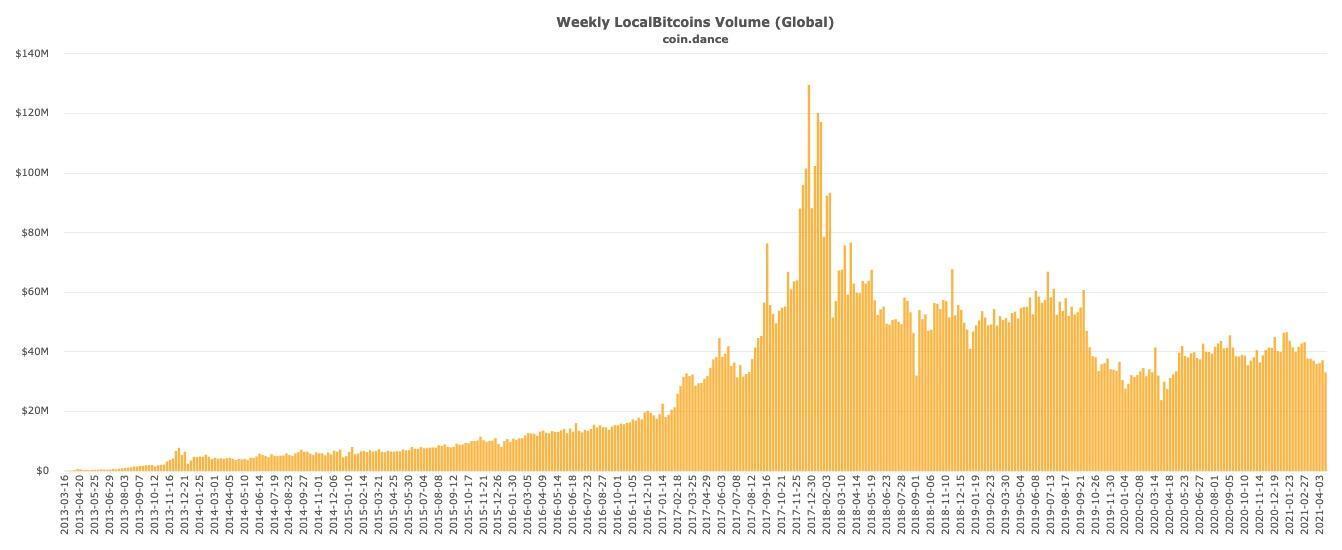
Source: Coin Dance
This chart indicates that LocalBitcoins’ global trading volumes have been on a long-term decline since December 2017, and that even 2019’s volumes are higher than those for the current bull market. Again, this is very interesting, since LocalBitcoins boasted of a growth in users in February, having hit nearly one million in Q4 2020.
A similar picture emerges from Paxful, which despite seeing growth since 2017, also saw a slight decline from mid-2020 to the beginning of this year.

Source: Coin Dance
While the dip is small from 2020 to 2021, it still belies the idea that there was suddenly a massive surge in the bitcoin market. That said, data from the third P2P exchange — Bisq — does show a very noticeable spike in volumes at the start of 2021.
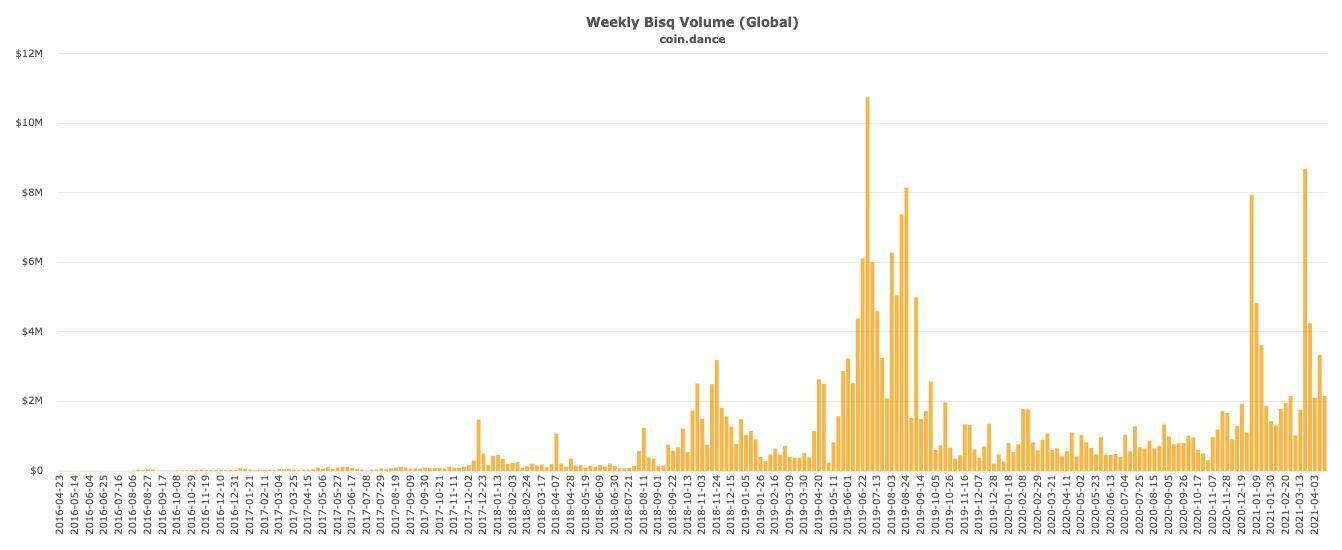
Source: Coin Dance
Even with those two big spikes in January and March, recent volumes haven’t managed to break the all-time high set for Bisq in June 2019. Bisq’s own data (measured in BTC rather than USD) also shows that current volumes — for bitcoin and altcoins — are down compared to levels in previous years.
The Big Exchanges Grow
So again, something strange appears to be happening here. Taking this data at face value, it seems hard to shake the suspicion that something fishy is going on with the present bull market, and with bitcoin’s ascent to an all-time high of $64,805.
Several of crypto’s most prominent skeptics and critics have long suggested that Tether and the printing of USDT is the primary reason why the market has taken off in recent months.
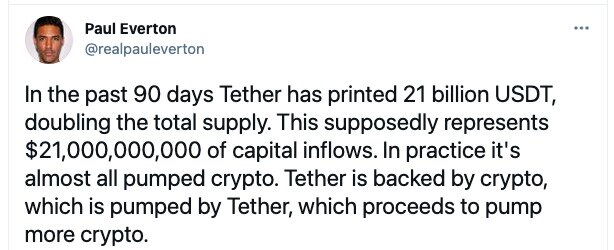
Source: Twitter
The New York Attorney General’s investigation into Tether found that the company’s issuance of USDT wasn’t fully backed between early 2017 and April 2019, while Tether’s continued failure to undergo a complete audit raises doubts that it’s 100% backed today.
It also raises suspicions that much of the current bull market may be the result of the supply of USDT increasing by 677% over the past 12 months. Tether itself denies this completely, and while some studies have suggested that USDT issuance doesn’t directly influence bitcoin prices, one famous 2018 paper from the University of Texas at Austin claimed that USDT was the main cause of the 2017 bull market.
The data from Coin Dance supports the idea that it’s the rising influx of USDT — rather than the rising supply of USD — which is mostly boosting cryptocurrency prices. It’s also supported by data from CryptoCompare, which reveals that USDT accounts for 54% of the bitcoin market, with USD coming second with 16%.
However, while Coin Dance’s data is certainly interesting, it has to be acknowledged that it’s very partial. LocalBitcoins, Paxful and Bisq represent only three exchanges, and they’re relatively minor compared to the big exchanges internationally.
Taking a look at CoinMarketCap’s volume data for Coinbase Pro, for instance, it shows a daily trading volume for bitcoin of $820 million. This is a 343% increase of the $185 million in bitcoin trading volume recorded for Coinbase Pro in November 2019, with other dates in the past also showing smaller volumes than today’s.
Likewise, Kraken (past data), Binance.US (past data) and Gemini (past data) all show marked increases in volumes compared to a year ago, highlighting the possibility that LocalBitcoins, Paxful and Bisq lost trade in 2020/21 relative to such exchanges. It’s also worth pointing out that Coinbase Pro and Gemini don’t support USDT, so their increases in volumes have little to do with Tether.
In other words, while Statista and Coin Dance’s data raises niggling questions about the reality of the current bull market, they hardly prove that most of it’s false. Still, they at least remind us to be skeptical of everything we read online and in the media about crypto, since the overall picture is very much mixed, to say the least.

Latest News