- >News
- >What Are the Top Indicators, Metrics for Crypto Traders?
What Are the Top Indicators, Metrics for Crypto Traders?
The cryptocurrency market is notoriously volatile, or at least it has been for much of its short history. While its volatility often provides an opportunity for big gains, it also makes price movements difficult to predict. This has often served to discourage beginner traders, since early enthusiasm can easily turn into later disappointment, especially if losses end up being significant. However, while the cryptocurrency (or any other) market will never be wholly predictable, there are a number of tools investors can use to help them navigate it more safely.
In fact, there are hundreds upon hundreds of different indicators and metrics crypto traders can use to analyze the cryptocurrency market. This article focuses on the six most useful of them, from moving averages and relative strength indexes to linear regression channels and Bollinger Bands. Taken together, these crypto indicators should help the careful investor time their trades a little more reliably, although it should be remembered that technical indicators shouldn’t be taken in isolation from fundamentals (i.e. news about the market).


Fear and Greed Index
Starting with probably the simplest, the Fear and Greed Index is a metric that ranks market sentiment from 1 to 100. 100 indicates highly bullish conditions (‘extreme greed’) while 1 indicates highly bearish conditions (‘extreme fear’).
There are a variety of Fear and Greed Indices in the cryptocurrency ecosystem, with Alternative.me’s Crypto Fear & Greed Index being the most well-known. It arrives at a measure of market sentiment by monitoring various sources of data, from price movements to social media activity.
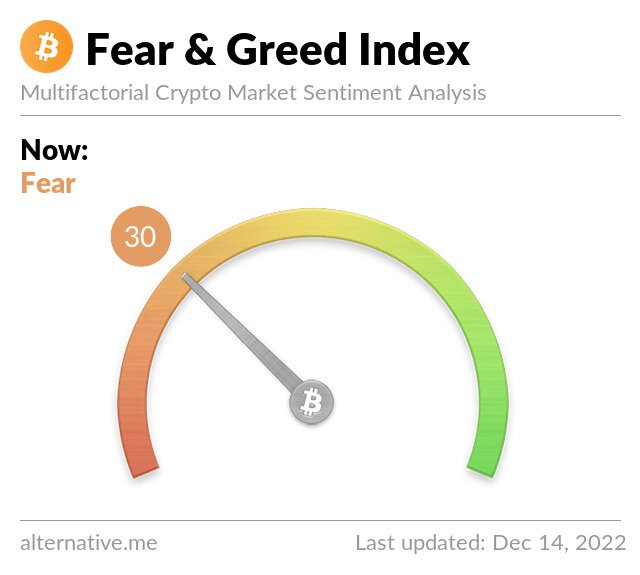
Source: Alternative.me
Basically, if the index is at the ‘greed’ end of the spectrum, it suggests that (further) price rises are more likely than falls, and vice versa for the scores at the ‘fear’ end. Of course, such data needs to be complemented with a reading of other sources of info, although the same goes for pretty much every metric in this article.
Relative Strength Index (RSI)
The relative strength index is a gauge of an asset’s momentum, calculated by comparing current prices against recent averages. Its job is to indicate whether a given cryptocurrency or stock is overbought or oversold.
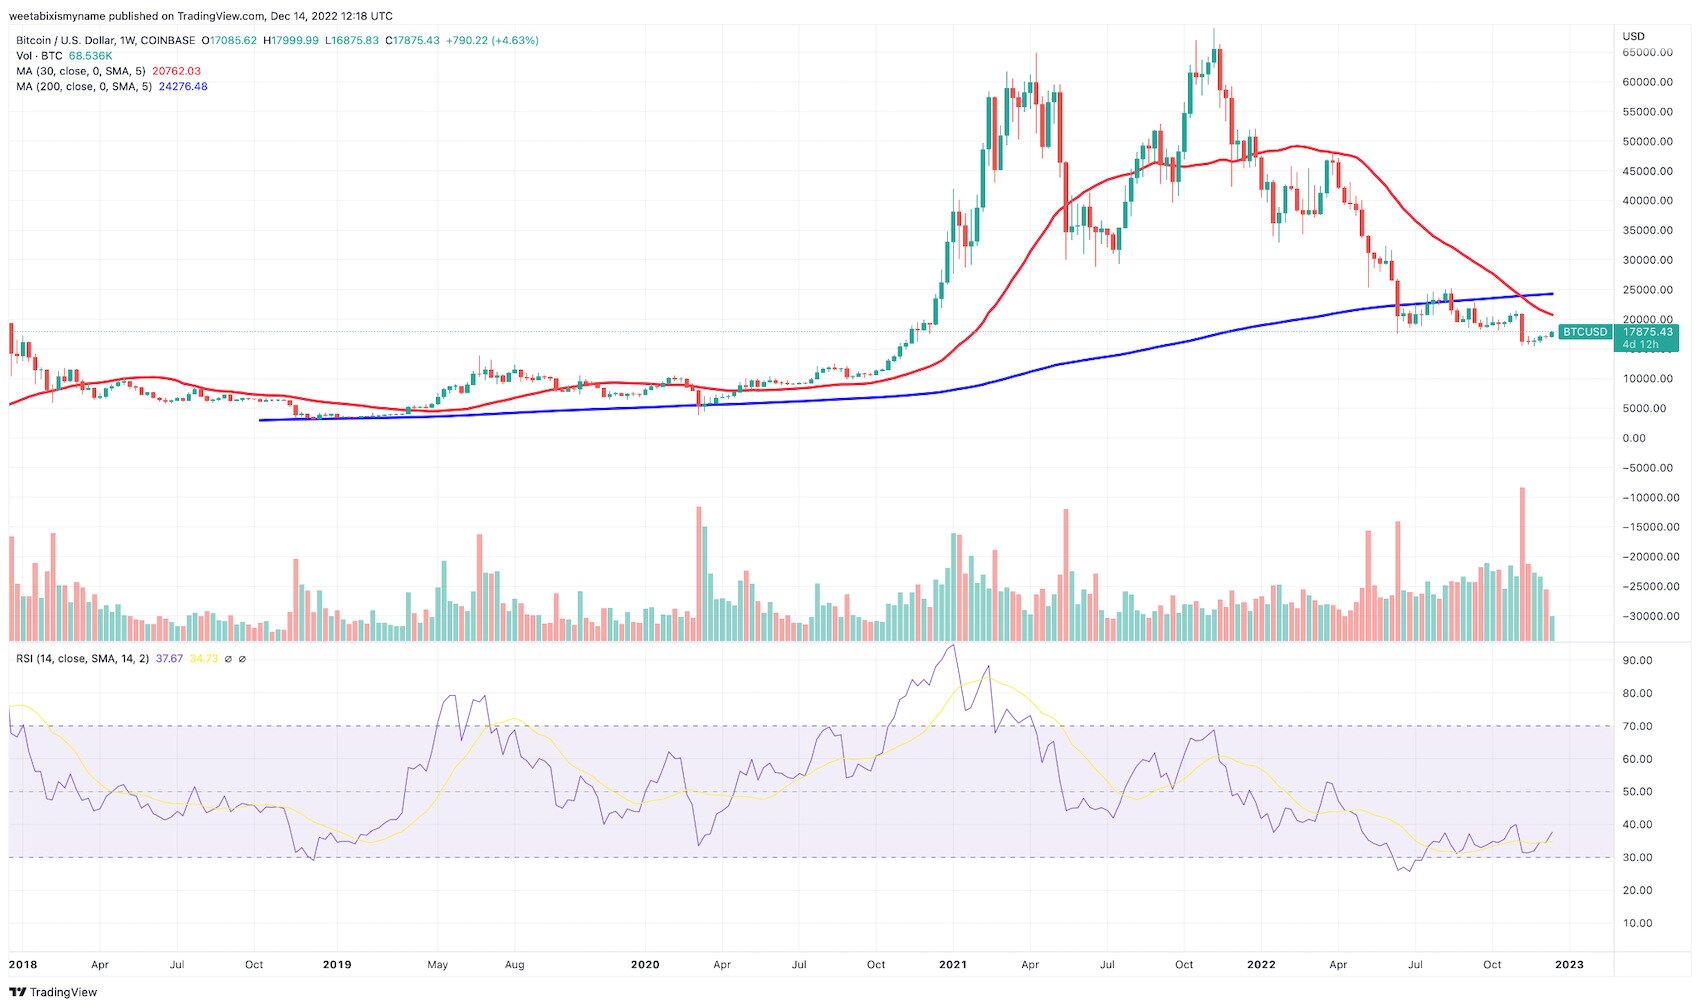
Source: TradingView
In the chart above, bitcoin’s relative strength index is shown in purple (more about the red and blue lines below). The RSI is at its most useful and informative when drawn over a longer period of time, with bitcoin’s current RSI being under 40. This indicates that BTC remains oversold, with the cryptocurrency looking like it hit a bottom around July of 2022.
When the RSI falls above 70 (and rises higher), it’s generally taken to mean that its overbought (at its top), and may begin falling at some point in the not-too distant future. This was indeed the case in November 2021, when bitcoin’s RSI passed 90.
Likewise, drops below 30 tend to indicate a bottom, although it can take months for an asset’s price to fully recover from such a bottom.
Moving Averages (MAs)
Moving averages are another useful metric for measuring momentum, especially when a trader compares a short-term average against a longer term average. MAs are produced simply by calculating an average price for a given asset across a particular time frame (e.g. 30 days, 90 days, 200 days, and so on.
In the bitcoin chart above, the red line indicates BTC’s 30-period moving average, while the blue line is its 200-period average. Comparing both is useful because they can reveal trends, with the chart above showing that BTC’s 30-period average fell below its 200-period in October. This is known as a ‘death cross,’ and usually signals further losses (which was in fact the case in the chart above).
Of course, as a lagging indicator, moving averages only reveal past trends, and cannot guarantee the future. Still, when combined with other metrics they provide a useful hint as to future trends in the cryptocurrency market.
Linear Regression Channel
More for shorter term and day traders, linear regression channels are used to determine the direction of trends, providing buy and sell signals to traders who know how to use them.
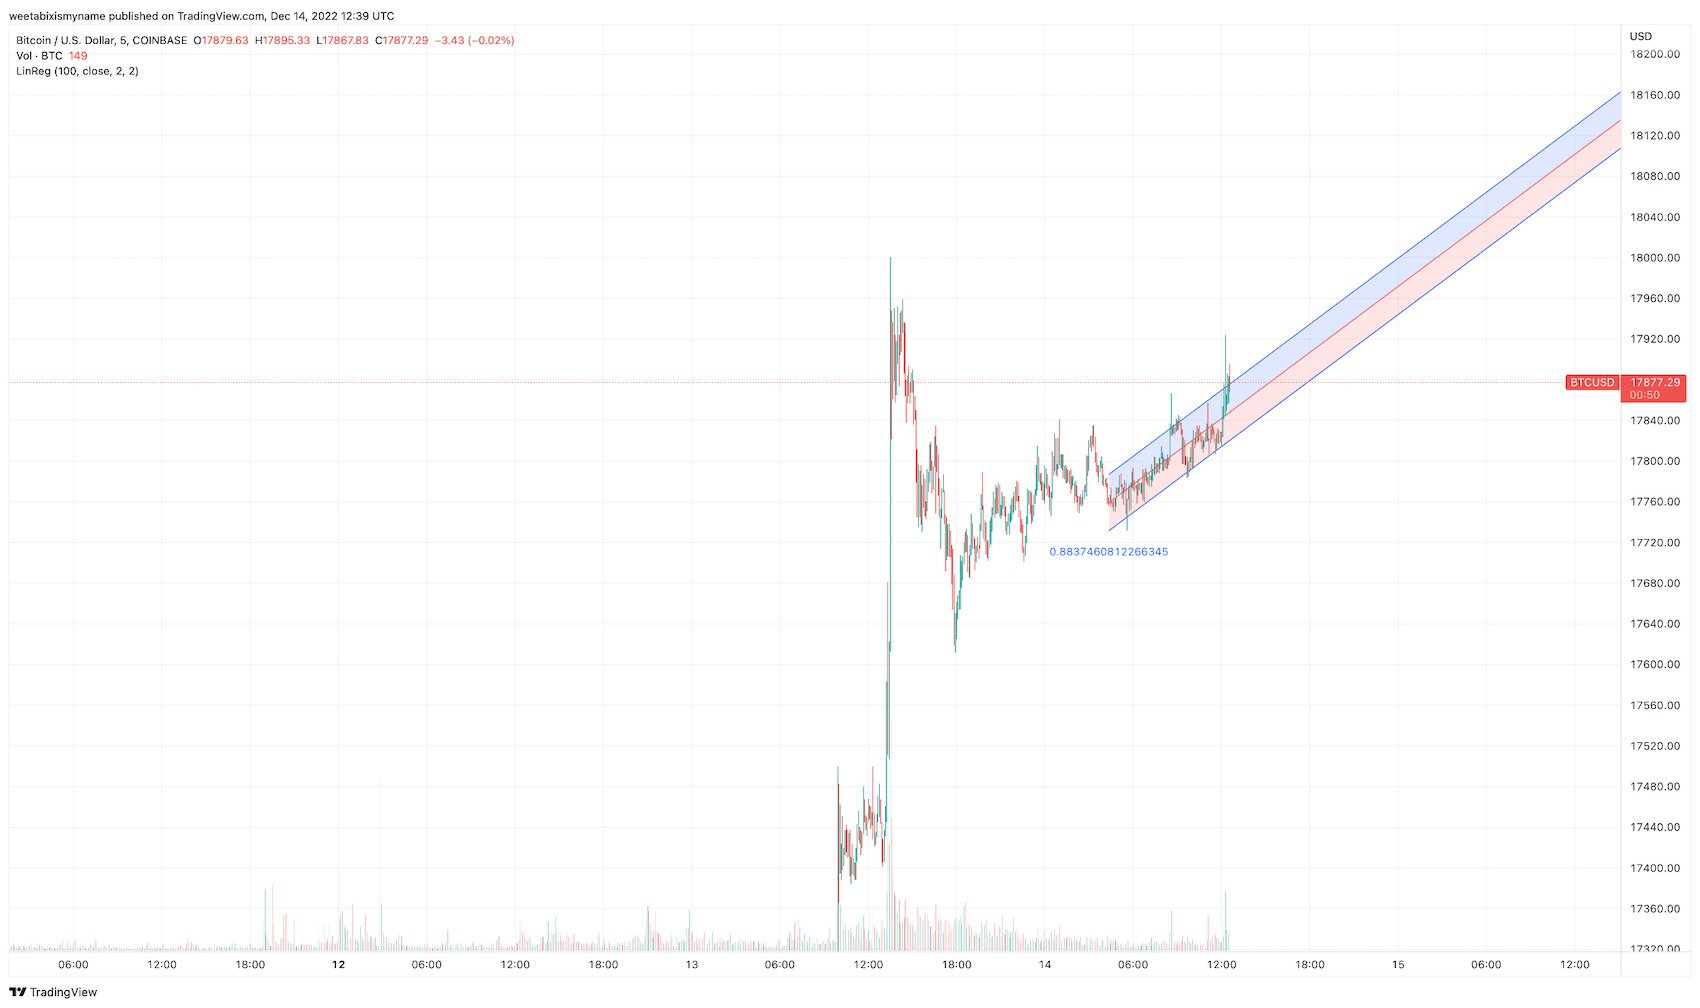
Source: TradingView
In the chart above, the blue and red channels are used to predict when bitcoin is likely to swing back upwards, or downwards. In this particular example, the latest BTC price record has peaked above the top of the blue channel, signaling that it’s likely to come back down again, and that it therefore may not be a good time to buy, at least if you’re looking for a very quick profit.
Bollinger Bands
Bollinger bands are top and bottom trend lines drawn by calculating two standard deviations away from the moving average for any given asset. As with other indicators on this list, they serve to indicate the top and bottoms of an asset’s recent price action, thereby indicating incoming rallies or selloffs.
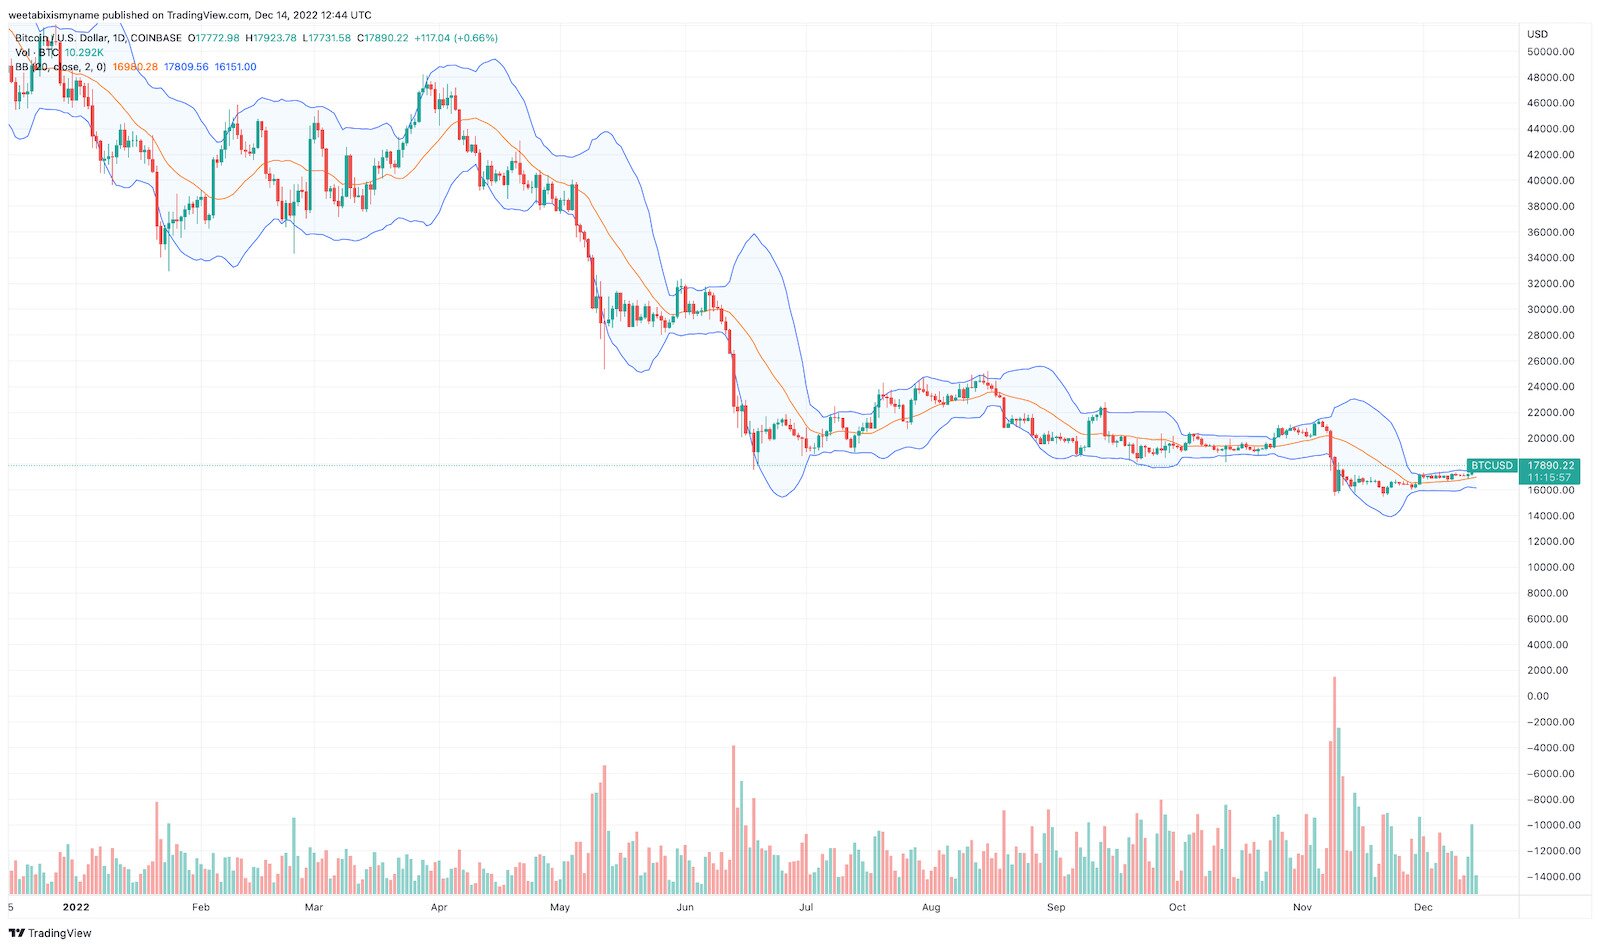
Source: TradingView
As the chart above illustrates, bitcoin’s price touching the bottom of a Bollinger band tends to indicate either a rally or the end of a decline. Conversely, reaching the top portends a drop.
Using Bollinger bands in conjunction with RSIs, moving averages and other metrics can help provide a comprehensive account of what a cryptocurrency is likely to do next. Although again, technical indicators can always be caught out by a piece of unexpected news or ‘Black Swan’ event.
Moving Average Convergence/Divergence
While this is probably the most complex metric feature here, the moving average convergence/divergence is arguably the most powerful in terms of predicting incoming movements. That’s because it shows how far short-term price momentum is diverging from long-term momentum, providing another indicator of bullishness or bearishness in the market.
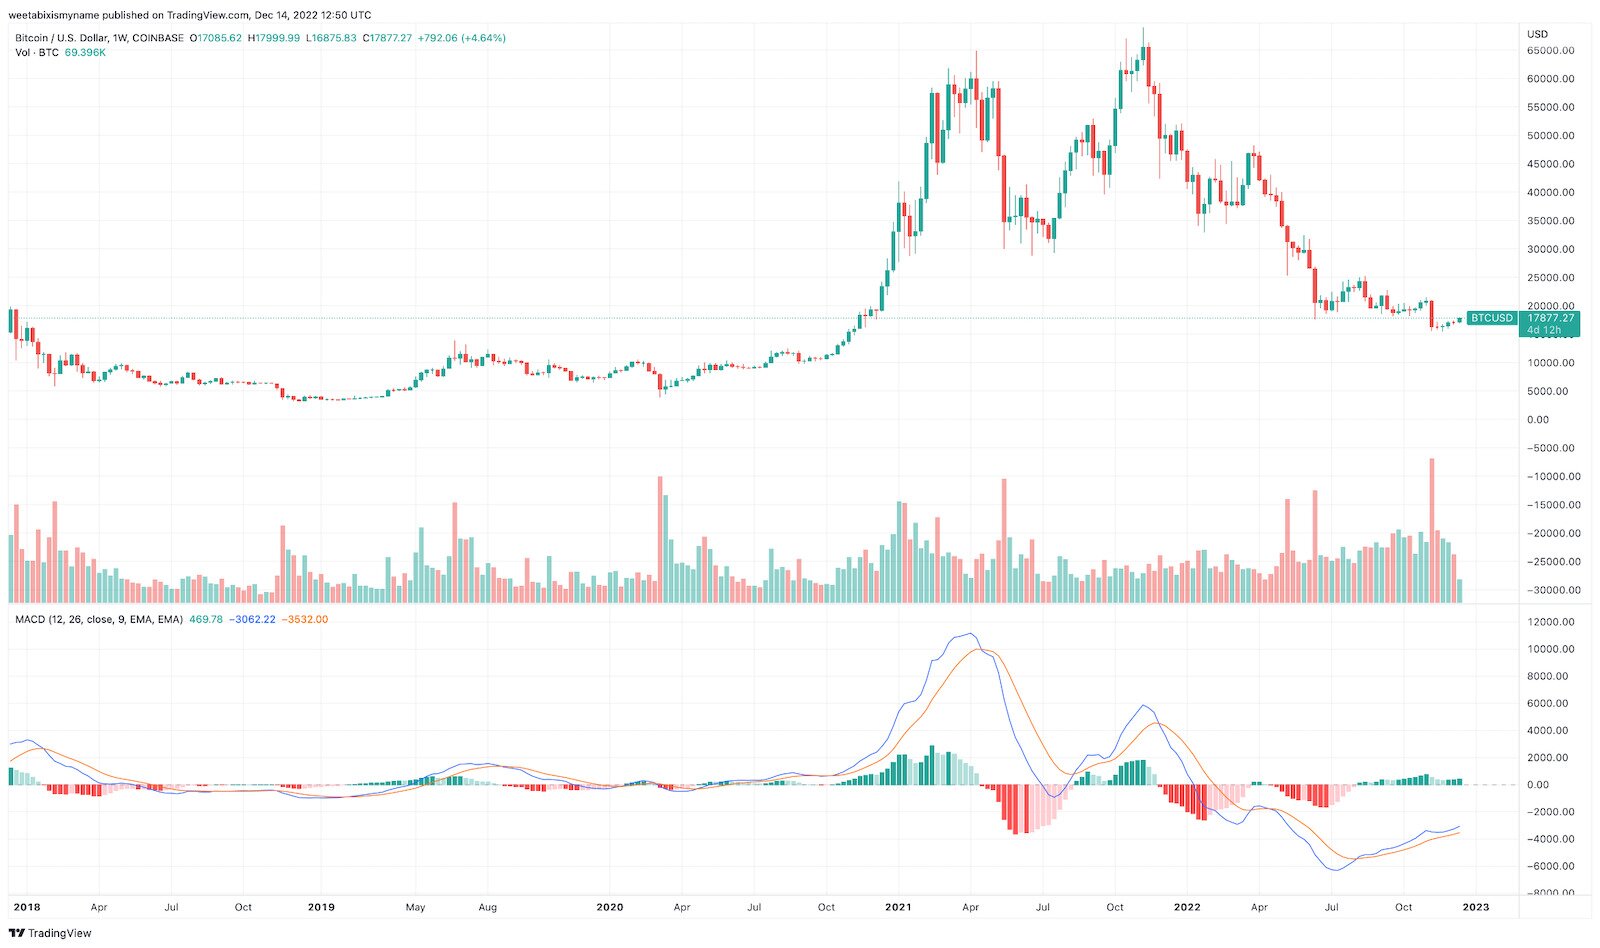
Source: TradingView
There are three pieces of information to consider in a moving average convergence/divergence. These are the MACD line (in blue above), the MACD Signal line (yellow/orange) and then the bars in either green or red. These bars show by how much the MACD line is diverging from the MACD Signal line, with green bars indicating that it’s higher, and red bars indicating that it’s lower.
Essentially, the idea here is to show the direction of momentum: if the blue MACD line is above the yellow MACD Signal line, then price movements are likely to be positive (and vice versa).
Conclusion: Technicals AND Fundamentals
Regular monitoring of the metrics above can help a trader predict market developments with more accuracy. However, because they are all based on past data, they really need to be balanced out with a reading of cryptocurrency market news, which can provide further clues as to what is going to happen in the coming days, weeks and months.
This includes an understanding of any given cryptocurrency’s fundamentals, which provide insight into how the market is likely to take to that cryptocurrency in the future. Only by looking at the entire picture like this can a trader or investor be confident that they’ve done as much as they possibly can to improve their chances of profiting.

Latest News